The Demo Project reads the data from the SQLite Database Table and draws a graph chart.
It has the following features.
- Demo Project built with Delphi Berlin update2.
- Multi Platform Support: Windows / Mac OS X / Android / iOS.
- Demo uses SQLite but uses FireDAC, so all databases can be linked.
- Database Table Generates graphs that match the aspect ratio automatically, regardless of the number of records.
- The Demo draws two charts, but you can easily draw multiple charts simultaneously.
- Graph range is based on maximum value of record value and can be specified at runtime.
- 2D Graph can draw on all Firemonkey's visible objects (TControl). Demo created above Rectangle object.
- The total size of the 2D Graph is automatically set to match the size of the dynamically generated TLayout.
- 3D Graph can be changed by mouse or touch Viewpoint.
- 3D Graph size is set as camera Z coordinate value.
- The 3D Graph range is automatically set to match the size of the dynamically generated TLayout3D.
- The front and back positions of the screen reference of the 3D chart which is generated redundant are designated as the Z coordinate value of TLayout3D.
- For Demo, 3D Graph Chart can be easily called from other projects using TFrame.
2D chart creation method
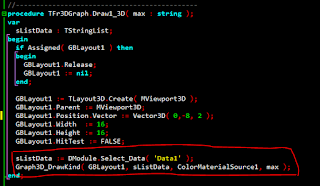
3D chart creation method


hi
답글삭제Would you like to share the code with me ?
답글삭제The GUI is so good.
My email is thismoment@qq.com